Energy Futures
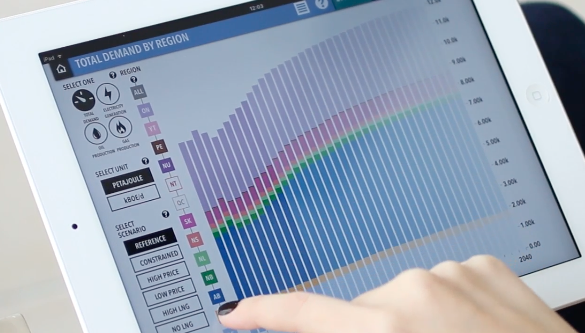
Based on data from the CER's Energy Futures reports, these visualizations allow you to explore energy production and consumption trends and forecast them into the future.
Explore the visualization View source code on GitHub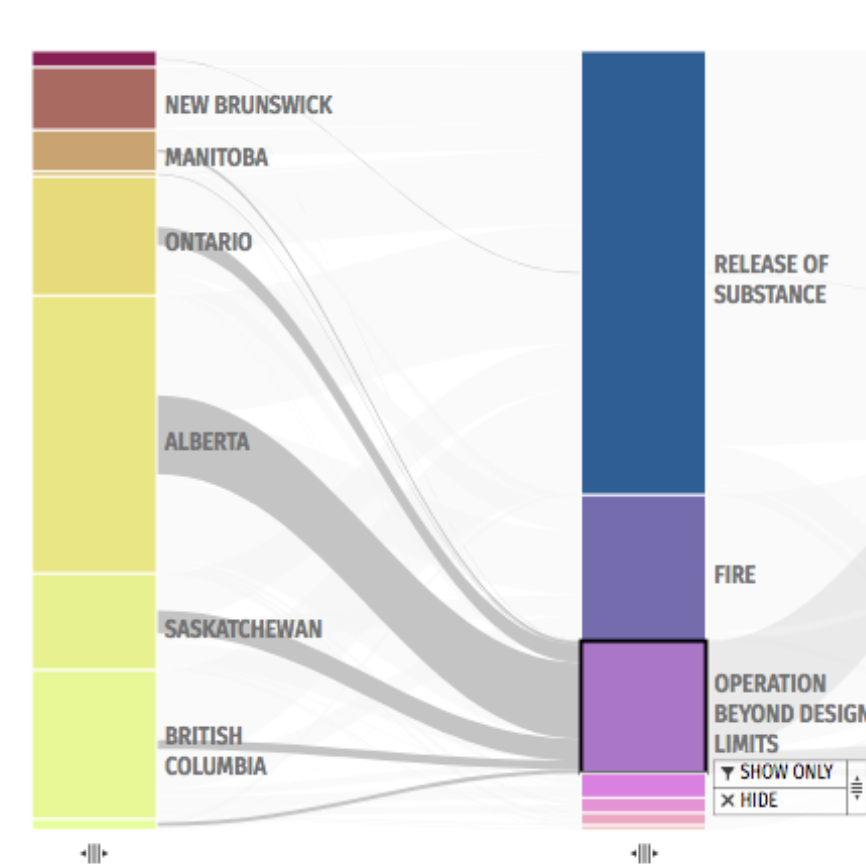
The energy visualization project is an open data initiative that is focused on developing advanced, interactive data visualizations that will help make Canada's energy data publicly accessible, transparent and understandable. This is a team project in collaboration with the Canada Energy Regulator (CER), formerly called the National Energy Board of Canada (the NEB).
Explore our work so far:

Based on data from the CER's Energy Futures reports, these visualizations allow you to explore energy production and consumption trends and forecast them into the future.
Explore the visualization View source code on GitHub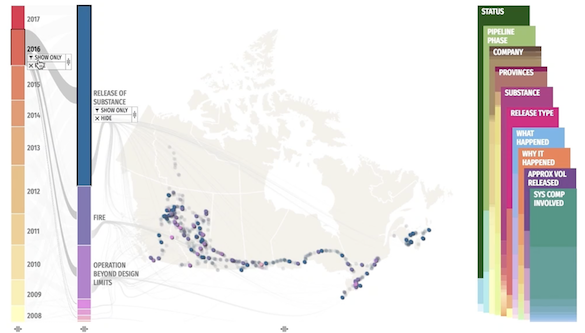
This visualization allows you to explore data about incidents that have occurred at CER-regulated pipelines and facilities since 2008.
Explore the Visualization Learn more (World Design Summit presentation slides) View source code on GitHub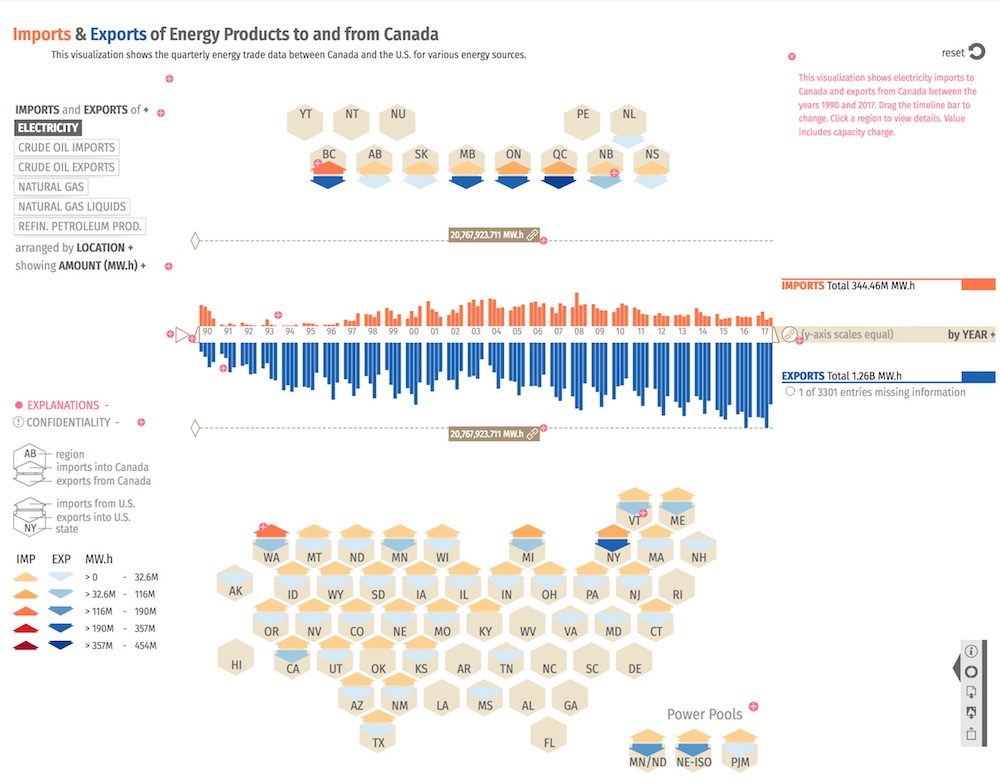
This online tool portrays imports and exports of energy products to and from Canada. This visualization show quarterly energy trade data between Canada and the U.S. since 1985, with the exception of electricity data which is available back to 1990.
Explore the visualization View source code on GitHub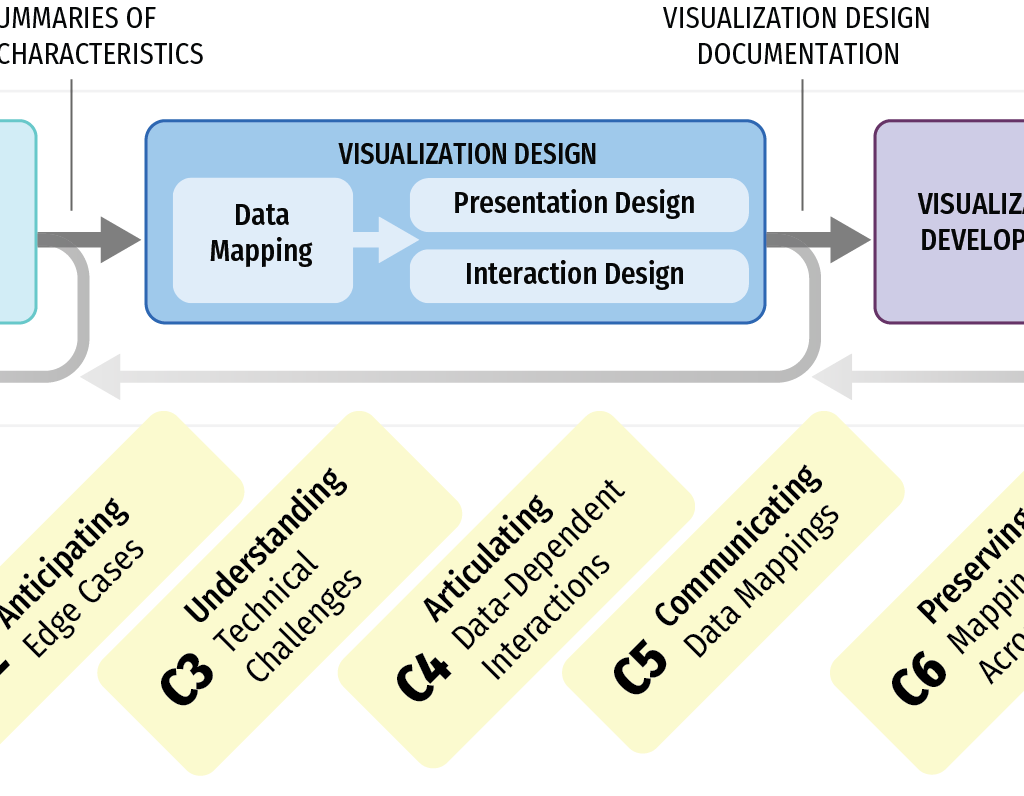
In this research project, we explore how data visualization design is not like interaction design. By reflecting on our experiences designing visualizations, we find six data-related challenges in visualization design.
Find the pre-print on arXiv.org View the 30-second preview videoThe CER visualizations have already won a federal award, when the NEB (now called CER) was awarded the 2016 Regulatory Excellence Award for Contribution to Innovation in the Regulatory Field. The visualizations we create will be released to the public, and we will interview stakeholders to make sure their needs are addressed. The visualizations provide us with a way to study the impact of visualizations on making open data accessible, and provide us with many challenges that require cutting-edge research and have significant potential for high-quality research output.
We regularly host a wonderful range of speakers from all over the world and they are here to spread their passion for data. Our lectures include an overview of speakers' research regarding data and data visualizations.
Our previous speakers' topics have included: visual narratives, digital technologies and environmental change, accessible web visualizations, augmented visual perception, browsing sound collections, infographics beyond pictures, and thinking with sketches
See all speakers in our speaker series.
The Energy Visualization Research Project is led by Dr. Sheelagh Carpendale in the Innovations in Visualization lab and Dr. Wesley Willett in the Data Experience lab at the University of Calgary. This project is in collaboration with the National Energy Board and The Hester View. Software development is provided by VizworX.
Our research & design team is part of the larger Interactions Lab at the University of Calgary, a world-class HCI and Information Visualization lab with creative and motivated researchers, including more than 40 students and 7 professors.